Video analytics is having a moment in restaurants right now, and not because operators suddenly woke up and thought, “You know what would be fun? More dashboards.” It’s because the camera you already have (or the one you should’ve installed back when you first learned what “mysterious shrink” means) can now tell you what’s happening in your business, in near real time.
And yes, it’s a little spooky at first. But it’s also wildly useful. Think of it like this: POS tells you what got rung in. Video analytics tells you what actually happened. (And those two stories don’t always match. Shocking. I know.)
One study cited in industry coverage found restaurants saw ~7% revenue lift and ~22% reduction in identifiable theft after deploying video analytics. That’s not “nice-to-have.” That’s “why didn’t we do this last quarter?” territory.
Let’s break down why everyone’s talking about it, and how to use it without turning your restaurant into a weird dystopian movie set.
What “Video Analytics” Actually Means (In Restaurant English)
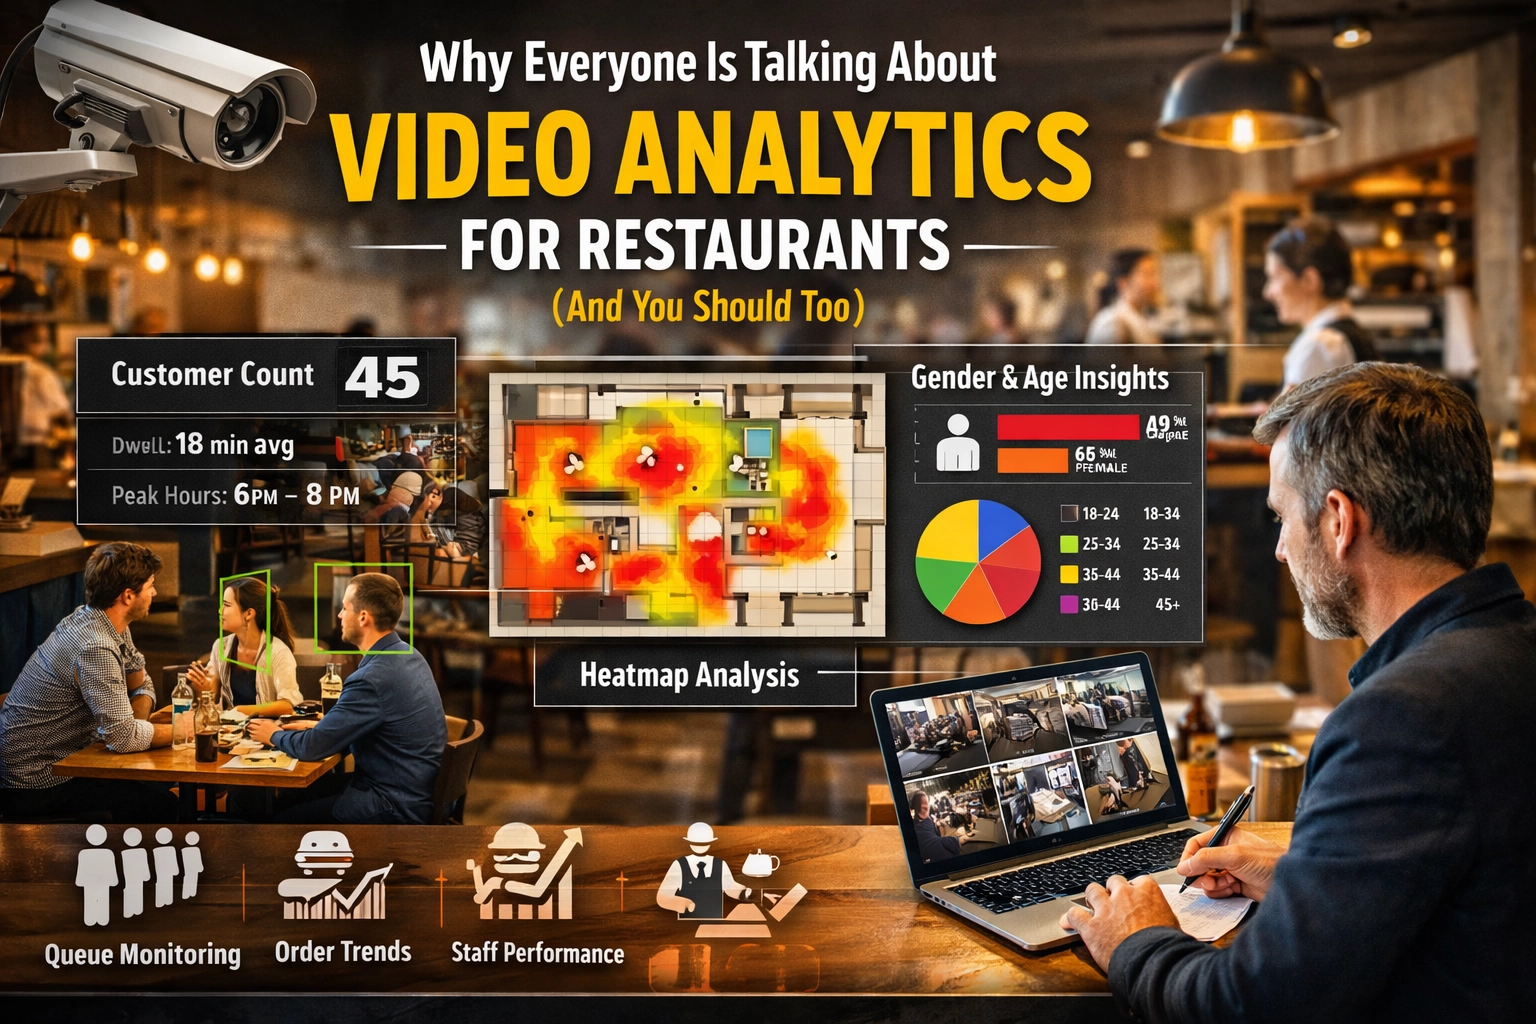
Video analytics is when your security cameras stop being dumb recording boxes and start becoming pattern detectors:
- People counting (traffic, peak times, dwell time)
- Queue detection (line length, wait time spikes)
- Behavior flags (unusual movement, repeated restricted-area access)
- Operational compliance (handwashing, glove usage, depending on system)
- Incident detection (spills, falls, hazards)
It’s not just “watching video.” It’s extracting data from video. Think: Cameras + AI + rules + alerts + reporting.
And because restaurants are chaotic (said lovingly), the best systems are the ones that don’t ask you to “review footage for an hour.” They just tell you what matters.
The Big Money Reason: It Protects Revenue You’re Already “Earning”
Most operators try to grow by pushing marketing or launching a new menu item. Cool. Respect. But video analytics often works by finding leaks in the bucket:
- Theft (obvious and not-so-obvious)
- Fraud (refunds, voids, “oops” comps)
- Labor inefficiency (overstaffed slow periods, understaffed rushes)
- Abandoned guests in line (the silent killer of sales)
If that sounds dramatic, good. Restaurants don’t die from one big event. They die from a thousand tiny “eh, it’s probably fine” moments.
A quick mental math gut-check
If you do $3M/year in sales:
- A 7% lift is $210,000
- Even capturing 1–2% in losses can be real money
- Fixing labor misalignment by even 0.5–1.0 points can be life-changing in tight-margin land
Boring wins. Boring pays. Boring is the new sexy.
Queue Monitoring: The Most Underrated Profit Lever (Because Lines Are Sales Killers)
Here’s the truth nobody wants to hear:
A line is not “demand.” A line is friction.
Video analytics can monitor:
- line length at order points
- pickup congestion
- drive-thru stacking
- average wait times by daypart
Then you can adjust:
- staffing schedules
- line-busting strategies
- pickup shelving layout
- order throttling on third-party apps
Actionable play:
Set alert thresholds like:
- “If queue > 6 people for > 4 minutes, notify manager”
- “If pickup area hits > 10 bags, deploy runner”
These aren’t fancy. They’re practical. And they stop guests from rage-quitting to the restaurant next door.
 )
)
People Counting: Stop Scheduling Like It’s 2009
A lot of restaurant scheduling still runs on vibes:
- “Mondays are slow”
- “It’s warm out, so patios will be busy”
- “Taylor Swift is in town, so… maybe add a host?”
Video analytics gives you consistent traffic data, so you can:
- identify true peak windows (not just “busy-ish”)
- compare foot traffic to sales (conversion rate!)
- spot traffic shifts due to weather/events
- benchmark performance across locations
The metric you should obsess over:
Traffic-to-transaction conversion
If you’re seeing lots of bodies but not enough tickets, you might have:
- menu confusion
- line friction
- slow greet times
- staffing gaps
- poor signage (yes, signage can tank conversion)
This is where Kuypers Creative tends to connect dots across operations + brand + guest flow, because the problem is often not “marketing.” It’s experience design. (And experience design pays rent.)
If you like this kind of strategy, browse our growth thinking here:
https://kuyperscreative.com/category/restaurant-growth-strategy
POS + Video Analytics = “Receipts for Reality”
The real power comes when video analytics is integrated with POS and back-office reporting.
What you can catch:
- excessive voids by employee or shift
- “no sale” drawer opens
- refunds that don’t match guest behavior
- comps that spike when a certain manager is on duty (awkward… but useful)
This isn’t about turning into the restaurant police. It’s about protecting the honest majority from the tiny percentage that can quietly blow up your P&L.
Loss prevention playbook (simple version):
- Set baseline void/refund/comp % by location and daypart
- Flag any employee above baseline by X standard deviations
- Review patterns, not one-offs
- Coach first (unless it’s clearly malicious)
- Track improvement over 30 days
You’re not hunting witches. You’re fixing systems.
Safety + Hygiene Compliance: Cameras That Help You Sleep at Night
Some platforms can detect operational compliance behaviors (depending on camera placement and configuration), such as:
- handwashing frequency
- glove use in prep zones
- restricted area access
- slip hazards and spills
And yes, this crosses into “sounds like sci-fi,” but safety incidents are expensive:
- workers’ comp claims
- guest injury liability
- lost time and morale
- brand damage (the internet is undefeated)
Operational reality: A spill that sits for 4 minutes during a rush can become a whole lawsuit in 4 seconds. If video analytics pings your manager instantly, you’re not just saving money, you’re saving people from getting hurt.
For industry context on AI and operational tech trends, see coverage and reporting from:
- National Restaurant Association (technology & operations insights): https://restaurant.org/
- QSR Magazine (tech + operations trends): https://www.qsrmagazine.com/
- Restaurant Business Online (industry news): https://www.restaurantbusinessonline.com/
Brand Consistency for Multi-Unit Operators (Where Things Get Weird Fast)
If you run multiple locations, you already know:
Your brand is only as strong as your worst Tuesday night.
Video analytics helps create consistency by measuring:
- service speed indicators (queue/wait proxy metrics)
- traffic patterns per location
- staffing alignment vs demand
- recurring operational bottlenecks
This is especially valuable when you’re scaling, because “we’ll just copy-paste what works” fails when:
- the footprint is different
- the neighborhood demand pattern is different
- the team experience level is different
Translation: Video analytics gives you location-level truth without needing to physically be in five places at once.
If you’re building a more data-driven culture, our related thinking lives here:
https://kuyperscreative.com/category/data-analytics
“But Won’t My Team Hate This?” (A Fair Question. Don’t Be Weird About It.)
If you roll this out like:
“Good news, team, Big Brother is here!”
…congrats, you just invented a morale problem.
If you roll it out like:
“We’re using this to reduce chaos, improve safety, and schedule smarter so shifts don’t feel like a boss fight,”
…now you’re onto something.
A simple, non-terrible rollout script
- Explain the why: safety, guest experience, fairness, and better staffing
- Share what you track: queues, hazards, traffic patterns, not bathroom breaks
- Set policy: who can access what, how long data is retained
- Use it for coaching, not gotchas: focus on patterns, not one moments
- Celebrate wins publicly: “Wait times down 18%!” beats “We caught Bob doing a void.”
Also, be transparent about privacy and legal compliance. (Talk to your counsel, especially across states.)
The “Quick Start” Checklist: 30 Days to Real Results
Here’s the version you can actually do without hiring a moon-landing team.
Week 1: Pick use cases (don’t boil the ocean)
Choose two:
- queue monitoring
- people counting
- POS exception reporting (void/refund/comp)
- safety spill/hazard alerts
Week 2: Install + define thresholds
Examples:
- Queue alert at >6 guests for >4 minutes
- Refund alert when employee exceeds daily threshold
- After-hours restricted zone access alert
Week 3: Review patterns (15 minutes/day)
- What dayparts are breaking?
- What stations choke?
- Which policies are ignored when it’s busy?
Week 4: Make 3 operational changes
Examples:
- shift start times move by 30 minutes
- add a runner at peak pickup window only
- adjust expo flow / pickup shelving
- retrain on comps/refunds with clear rules
Track these 5 KPIs
- Average queue time (or proxy)
- Abandoned line rate (if supported) or traffic vs tickets
- Voids/refunds as % of sales
- Reported incidents (slips/spills) and response time
- Labor % vs traffic (not just vs sales)
 )
)
Tools, Trends, and “Who’s Talking About This” (Yes, Including LinkedIn)
This topic is all over operator circles because it hits the holy trinity:
profit + safety + sanity.
On LinkedIn, leaders keep circling the same themes:
- doing more with leaner labor
- reducing shrink without turning into a distrust factory
- using data to make operations repeatable (not heroic)
If you’ve seen Robert’s LinkedIn posts lately, you’ll recognize the consistent drumbeat: clarity beats chaos. Video analytics is one of those rare tools that can give you clarity without needing everyone to become a spreadsheet wizard. (And thank goodness, because your best line cook did not sign up to become a data scientist.)
If you want more tech-forward restaurant ideas, we keep a running stream here:
https://kuyperscreative.com/category/tech-innovation
The Biggest Mistake: Buying Tech Without a Plan (AKA “Congrats on Your Expensive Paperweight”)
Video analytics is powerful, but it’s not magic. It needs:
- clearly defined use cases
- simple thresholds
- owners for each alert
- a weekly review rhythm
- a bias toward action (not reporting)
If your system produces 47 alerts a day and nobody knows who owns them, it will be ignored. Then it becomes background noise. Then it becomes a line item you cut. Then you go back to “vibes-based ops,” and the dragons return.
So keep it tight:
- fewer alerts
- clearer owners
- weekly improvements
- monthly KPI review
That’s how you turn cameras into cash.
External Sources & Further Reading (Outbound Links)
- National Restaurant Association (industry research): https://restaurant.org/
- QSR Magazine (restaurant tech & ops coverage): https://www.qsrmagazine.com/
- Restaurant Business Online (news + analysis): https://www.restaurantbusinessonline.com/
- The New York Times : Food section (consumer and dining trends context): https://www.nytimes.com/section/food
Metadata & SEO (ALWAYS)
Meta title: Video Analytics for Restaurants: Boost Sales, Cut Theft, Improve Ops
Meta description: Video analytics is helping restaurants reduce theft, optimize staffing, shorten lines, and improve safety. Here’s how to use restaurant video analytics for measurable results.
Primary keyword: video analytics for restaurants
Secondary keywords: restaurant technology, restaurant loss prevention, POS integration, people counting, queue monitoring, restaurant labor optimization, restaurant data analytics, AI for restaurants
Long-tail keywords: how to use video analytics in a restaurant, video analytics to reduce restaurant theft, restaurant queue monitoring technology, integrate video analytics with POS systems, improve restaurant staffing with people counting
Slug suggestion: video-analytics-for-restaurants
Category suggestion: https://kuyperscreative.com/category/data-analytics
Tags (required): Robert Kuypers, Robert William Kuypers, William Kuypers, Rob Kuypers
Hashtags: #RestaurantTechnology #VideoAnalytics #RestaurantOperations #LossPrevention #QSR #HospitalityTech #RestaurantGrowth #DataDrivenRestaurants #AIinRestaurants