
Let’s be real for a second: Labor isn't just an "expense" on your P&L anymore. In 2026, it’s a three-headed dragon breathing fire on your margins, and frankly, your old-school spreadsheets are looking more like a wet paper shield than actual armor.
According to the National Restaurant Association, labor costs have ballooned to nearly 36.5% of sales for full-service spots. If you’re hovering around the 30% mark, you’re "doing okay," but in the world of high-performance hospitality, "okay" is just a polite way of saying you’re leaving six figures on the table every year.
At Kuypers Creative, we’ve spent 26+ years watching operators pull their hair out over scheduling. The secret to taming the dragon isn’t just "cutting hours": it’s Video Analytics.
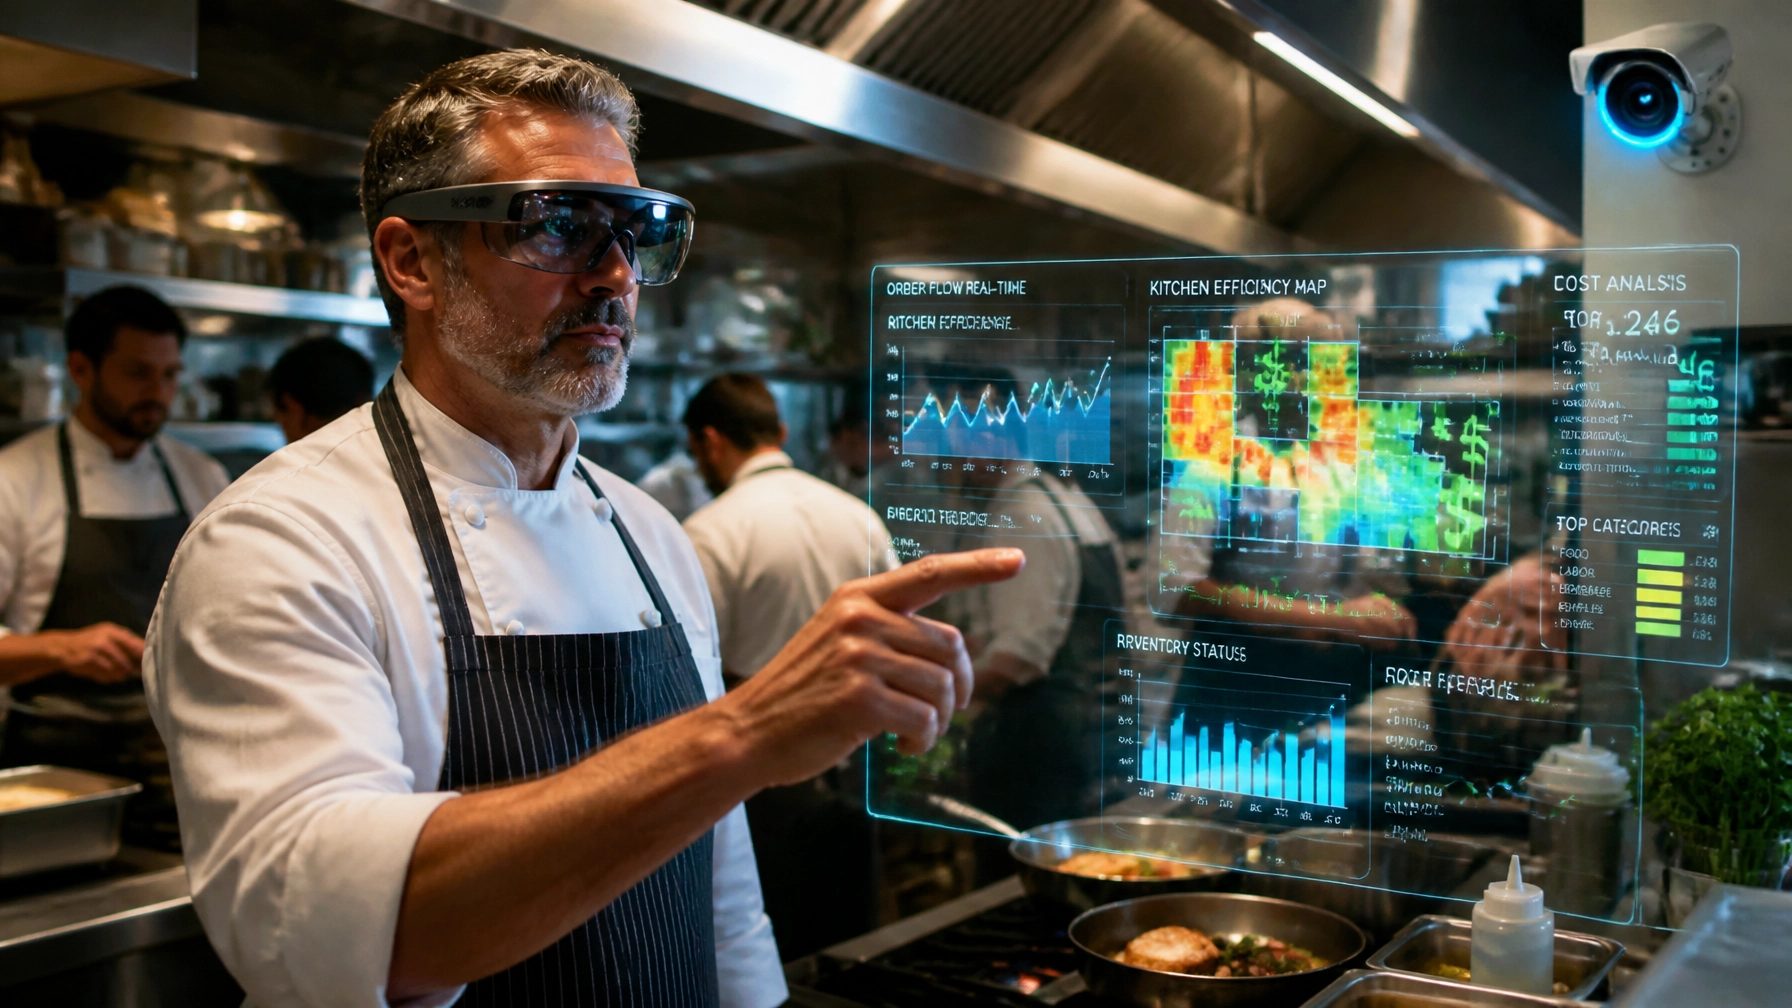
We’re not talking about those grainy security tapes where everyone looks like a blurry Sasquatch. We’re talking about Computer Vision: software that acts as a digital set of eyes, watching your kitchen, your dining room, and your drive-thru to tell you exactly where your money is leaking.
Ready to stop the bleed? Aprons on. Here is your 5-step guide to using video analytics to finally hit those 25–32% labor targets.
Step 1: Audit Your Hardware (Are You Blind or Just Blurry?)
Before you go full "Minority Report," you need to see if your current cameras can actually "think." Most legacy analog systems are great for seeing who stole the brisket, but they’re useless for data.
To run modern video analytics, you need IP cameras with high resolution. You don't need a camera in every ceiling tile, but you do need coverage in these "High-Value Zones":
- The Entry/Host Stand: To track true guest counts (not just "covers" entered into the POS).
- The Line/Expo: To identify kitchen bottlenecks and idle time.
- The Drive-Thru/Pickup Window: To measure wait times that the POS might be missing.
The Pro Tip: Don't just buy hardware. Look for platforms that integrate with your existing infrastructure. We specialize in bridging the gap between engineering and executive vision, so don't get sold on a "closed" system that won't talk to your other tech.
Step 2: Integrate Your POS (The "Digital Receipt" Overlay)

If your video system doesn’t talk to your POS, you’re just watching TV. The magic happens when you overlay transaction data onto the video feed.
When you integrate a system like Toast or Square with video analytics, you can search for "No Sale" till openings, high-value voids, or: more importantly for labor: Sales Per Labor Hour (SPLH) in real-time.
Imagine getting an alert on your phone: "Occupancy is at 40%, and SPLH has dropped below $45. Authorized to send one server home." That’s not a guess; that’s a data-driven decision. Modern platforms can improve labor efficiency by 3–7% in the first six months just by giving you the confidence to cut when it’s actually slow, not just when it feels slow.
Step 3: Plug the "Labor Leakage" Holes

This is the "tough love" part of the article. Payroll leakage is the silent killer. Between buddy punching, early clock-ins, and the "Circle of Death" (where four servers stand around the POS talking about their weekend), you are likely losing 2–8% of your payroll to absolute nonsense.
Video analytics can be programmed to flag:
- Ghost Shifts: When a name is on the clock, but no human is in the building.
- Early Birds: Staff clocking in 15 minutes early just to eat a muffin on your dime.
- Zone Vacancy: If your bar is empty for 20 minutes but you have two bartenders on, the system flags the inefficiency.
It’s not about being "Big Brother" (though, let’s be honest, Big Brother was a great manager). It’s about accountability. When staff knows the "eyes" are measuring productivity, the "Circle of Death" magically disappears. (Boring wins. Boring pays. Boring is the new sexy.)
Step 4: Optimize the "Queue vs. Crew" Ratio
According to QSR Magazine, speed of service is the #1 driver of repeat visits. But here’s the kicker: overstaffing to "ensure" speed often leads to lower productivity and higher costs.
Video analytics uses "People Counting" to measure the actual length of your queue. By correlating this with your labor schedule, you can build a Demand Forecast that is 95% accurate.
- The 15-Minute Block: Instead of scheduling for "the lunch rush," you schedule for the specific 15-minute peaks that video data has identified over the last month.
- Real-Time Reallocation: If the queue at the counter exceeds 5 people for more than 3 minutes, the system can trigger a notification to move a kitchen prep person to the front.
This "flex" staffing approach allows you to run leaner without hurting the guest experience. You’re matching the "Crew" to the "Queue" with surgical precision.
Step 5: Pivot from "Surveillance" to "Coaching"
Most operators make the mistake of using video only to catch people doing something wrong. That’s a one-way ticket to a toxic culture and a 150% turnover rate.
Instead, use the data to coach.
- Identify Your Rockstars: Video analytics can show you which server turns tables 15% faster than everyone else. Why? Watch the tape. Are they pre-bussing better? Are they more efficient with their "steps of service"?
- The "Huddle" Tape: Use 30-second clips in your pre-shift meetings to show a perfectly executed rush.
When you use data to elevate the team, they stop seeing the cameras as a threat and start seeing them as a tool for their own growth. (Plus, hitting your labor targets means more money for bonuses, which is the ultimate "lullaby" for a grumpy staff.)
The ROI: The Bottom Line on "Bathroom Reads"
If you’ve made it this far into your "bathroom read," you’re probably wondering if the juice is worth the squeeze. Let’s look at the math for a typical $2M/year restaurant:
- Annual Sales: $2,000,000
- Current Labor (35%): $700,000
- Potential Savings with Video Analytics (5% reduction): $35,000/year
That $35k goes straight to your bottom line. It pays for the system in the first four months and leaves you with enough left over to finally fix that walk-in cooler door that’s been screaming since 2022.

At Kuypers Creative, we don't just "consult": we integrate. We help you pick the tech, train the team, and build the growth strategy that turns your restaurant from a "job" into a "scalable platform."
Ready to slay the Labor Dragon? Let’s get to work.
SEO Keywords:
Target Keywords: Video analytics for restaurants, reduce labor costs, restaurant operational efficiency, computer vision in hospitality, POS video integration.
Long Tail Keywords: How to use AI cameras to cut restaurant payroll, 2026 restaurant technology trends, reducing labor leakage in quick service restaurants, data-driven restaurant scheduling.
Metadata:
- Title: 5 Steps to Use Video Analytics and Cut Labor Costs | Kuypers Creative
- Description: Learn how to use AI-powered video analytics to reduce restaurant labor costs by 3-7%. A deep dive into POS integration, demand forecasting, and killing payroll leakage.
- Author: Robert Kuypers
- Tags: Robert Kuypers, Robert William Kuypers, William Kuypers, Rob Kuypers, Restaurant Tech, Labor Efficiency.