
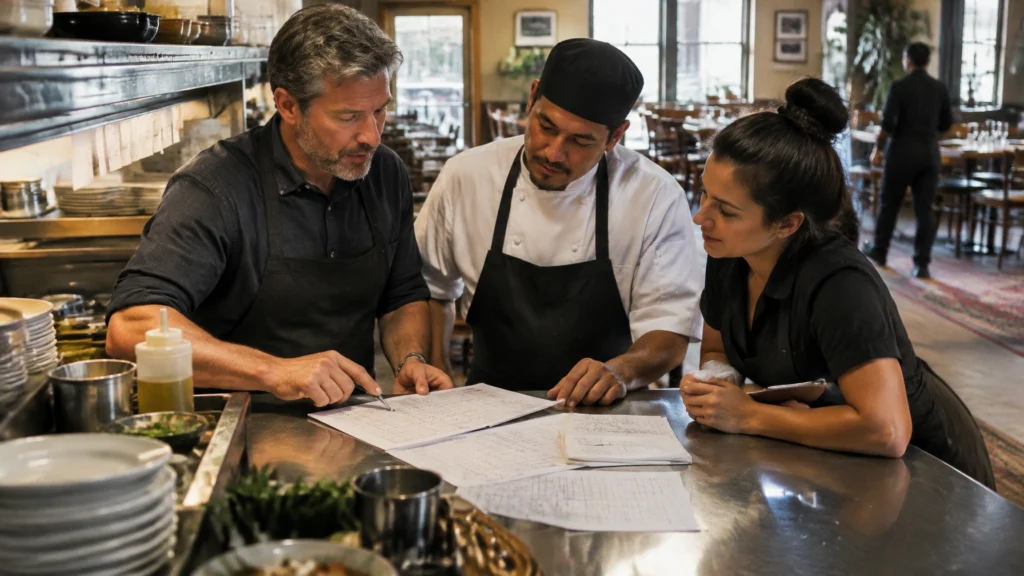
It’s October 2026. The restaurant industry is projected to do $1.55 trillion in sales, and the National Restaurant Association expects 15.8 million people to work in restaurants and foodservice. Those are enormous numbers. They are also a little abstract when you’re staring at Friday’s schedule and trying to figure out who can cover a double without turning Sunday brunch into a hostage negotiation.
The labor story this year isn’t simply “nobody wants to work.” That explanation is too easy, and it doesn’t help anyone write a better schedule. The real picture is more complicated: restaurants are still hiring, wages are rising, understaffing remains a problem for many operators, and turnover keeps draining time and money. At the same time, uneven demand makes it risky to solve every staffing problem by adding hours.
So what does the restaurant labor shortage in 2026 actually look like? And how can operators use better planning, technology, and management practices to protect service and margins, without treating their team like a spreadsheet with shoes?
Let’s get into it. The coffee’s hot; the labor report is longer than the specials board.

The numbers use different definitions and reference periods: BLS employment is a payroll series for food services and drinking places; the NRA’s sales and employment figures cover the broader restaurant and foodservice industry.
The restaurant labor market in 2026: Big industry, choppy growth
The National Restaurant Association’s 2026 State of the Industry projects $1.55 trillion in restaurant and foodservice sales, a modest 1.3% real increase after inflation. It expects the industry to add about 100,000 jobs, bringing total employment to 15.8 million.
The Bureau of Labor Statistics counts a narrower group. Its preliminary, seasonally adjusted estimate for food services and drinking places was 12.393 million jobs in September 2026. The two totals aren’t competing answers to the same question: they cover different scopes and use different methods. The NRA’s projection reflects the broader restaurant and foodservice industry; the BLS figure is a monthly payroll measure for a specific industry classification. (NRA: State of the Restaurant Industry 2026; BLS: Food Services and Drinking Places)
There’s a similar distinction in the understaffing numbers. The NRA’s broader 2026 summary says about one in four operators lack enough staff to meet customer demand. Its detailed staffing report puts the figure at 22%, down from 32% in 2024 and 78% in 2021. Either way, understaffing is less widespread than at the height of the post-pandemic scramble, but it remains a real constraint for many businesses. And for the short-staffed operators in the NRA’s research, the consequences aren’t minor: some limit operating hours, delay expansion, or struggle to serve demand. (NRA hiring and staffing report)
In other words, the industry isn’t uniformly short on people. It’s struggling to match the right people, skills, and labor hours to the right locations and shifts. A downtown lunch spot and a suburban dinner restaurant can face completely different hiring realities, even when they share the same logo and payroll system.
Wages are climbing. Labor costs are about more than wages.
BLS data show leisure-and-hospitality average hourly earnings reached $23.58 in May 2026, up about 4.0% year over year from $22.68. You may see a 3.6% wage-growth figure cited for May, but that refers to a different comparison; it shouldn’t be presented as the leisure-and-hospitality rate without checking the series and period. Industry averages also blur big differences in occupation, geography, tips, and hours. (BLS earnings data)
Now for the number operators feel in the P&L: labor cost as a share of sales. The NRA’s 2025 Operations Data Abstract reported that, in 2024, median salaries and wages, including benefits, were 36.5% of sales for full-service restaurants and 31.7% for limited-service restaurants. These are medians from the Association’s research, not universal targets or a promise that every concept should land at the same percentage. Service model, menu, hours, location, and the definition of “labor” all matter. (NRA: Restaurant labor costs are well above historical averages)
That last point deserves a sticky note above the office computer: labor percentage is a result, not a diagnosis. If sales fall and the schedule stays fixed, labor percentage rises even if staffing hasn’t changed. If you cut too deep, guests wait, the team gets crushed, and you may lose the sales you were trying to protect. A percentage without context is just a number wearing a manager’s hat.
Turnover: The costly revolving door
Restaurants know turnover. The industry has long relied on a mix of hourly and management employees, and people change jobs for all kinds of reasons. But a vacancy doesn’t just create a hole in the rota. It triggers recruiting, interviews, onboarding, training, schedule coverage, and the slow process of getting a new hire comfortable enough to work at full speed.
A commonly cited restaurant-specific benchmark from Black Box Intelligence puts the hard costs of replacing an employee at about:
| Role | Average hard replacement cost |
|---|---|
| Hourly employee | $2,305 |
| Non-GM manager | $10,518 |
| General manager | $16,770 |
These estimates cover separation, replacement, and training, not every downstream effect on service, team workload, or lost productivity. Other estimates put fully loaded replacement costs in the $3,500–$9,089 range for hourly roles, depending on the method and what’s included. Those figures aren’t directly interchangeable: one study’s “hard costs” may not include the same items as another’s broader estimate. The useful takeaway isn’t a magic universal number. It’s that the bill grows with time spent recruiting, training, covering shifts, and helping someone get up to speed. (Black Box Intelligence: State of the Restaurant Workforce; Gecko Hospitality: 2026 Culinary & Hospitality Workforce Playbook)

Black Box Intelligence’s 2024 estimates are hard replacement costs. Broader replacement estimates may use different definitions and methods.
Here’s the bit that often gets missed: experienced managers are expensive to lose because their value isn’t limited to their job title. A strong GM knows the team, the regulars, the vendor quirks, the prep rhythms, and which equipment makes a suspicious noise only when the inspector is nearby. When that person leaves, the operation has to rebuild that knowledge while still opening the doors.
And turnover isn’t only a hiring problem. It can be a signal. Compensation matters, but so do training, communication, scheduling, leadership, and whether people have a reason to believe the job will be workable next month.
A simple way to estimate your own turnover cost
Use your own numbers before borrowing anyone else’s benchmark:
- Add the hours managers spend recruiting, interviewing, onboarding, and training.
- Multiply those hours by the relevant loaded hourly cost.
- Add recruiting expenses, background checks, or onboarding costs.
- Estimate extra coverage, overtime, or agency labor during the vacancy.
- Track how long new hires take to reach expected productivity.
- Review the total by role, not just as one blended “turnover cost.”
It won’t produce a perfect figure. It will produce a more useful one than “I think hiring is expensive,” which is a statement every restaurant manager has made while staring into the middle distance.
Wage laws and tips: The cost of getting the details wrong
Federal law allows an employer to pay a direct cash wage of $2.13 per hour to a tipped employee, if the employer claims a tip credit and the employee’s wages plus tips reach at least the federal minimum wage of $7.25 per hour. That means the maximum federal tip credit is $5.12 per hour. Employers must meet applicable requirements, including informing employees of the tip credit and making up any shortfall when tips don’t bring pay to the required minimum. State and local rules may be more protective. (U.S. Department of Labor: Tip Regulations)
For 2026, examples of state and local minimum wages include $16.90 per hour in California, where employers cannot take a tip credit against the state minimum wage, and $17.00 per hour in New York City. These are examples, not a complete compliance checklist. Local ordinances and specific industry rules can change the answer, so employers should verify the rates that apply to every location. (U.S. Department of Labor: Consolidated Minimum Wage Table)
Tip pooling, overtime, deductions, and time worked before or after a shift can also create compliance risk. Federal law generally requires covered, nonexempt employees to receive overtime at one-and-a-half times their regular rate for hours over 40 in a workweek. Tip credits and tip pools have their own requirements; “we’ve always done it this way” is not a legal defense, even if it has a lovely family-recipe origin story.
A reliable tip management software system can help calculate and document distributions, but software doesn’t replace clear policies or legal review. The setup has to reflect the rules that apply to the business. (For an example of how tip workflows can be integrated into restaurant operations, see Kuypers Creative’s overview of TipHaus tip management.)
Forecasting and scheduling: The difference between planned labor and panic labor
The best scheduling tool in the world cannot predict every call-out, traffic spike, storm, or bus that unloads 18 hungry people at once. But it can make the normal week less mysterious.
Fourth’s State of Restaurant Operations 2026 survey found that 64% of respondents were not using AI or automation for operations. Among the operators using these tools, reported applications included sales forecasting (53%), labor forecasting (38%), and automated scheduling (31%). The survey also found that 44% of AI adopters reported profit margins above 13%, compared with 15% of non-adopters. That is a notable association, not proof that adopting AI caused higher margins. The study was based on a survey of 112 restaurant leaders, and the adopter/non-adopter groups were relatively small. (Fourth: State of Restaurant Operations 2026)
Toast has reported that restaurants using its Scheduling Pro averaged 41% fewer overtime hours per employee than restaurants not using the product. That comparison comes from Toast’s data and is not a controlled experiment or a guaranteed result for every restaurant. It is still a useful example of the kind of operational metric scheduling technology aims to influence: overtime hours, not just how sleek the calendar looks on a phone. (Toast Fall Release 2026)

Fourth’s findings are from a 2026 operator survey; Toast’s overtime comparison is company-reported. Neither figure is a promise of results for an individual restaurant.
A restaurant scheduling software platform should do more than let people swap shifts. Ideally, it connects sales patterns, dayparts, role requirements, availability, and actual labor data, then helps managers see where the plan and the real shift diverged.
A practical starting sequence:
- Forecast by daypart. Compare actual sales with the forecast for each daypart, not only the weekly total.
- Build around roles and demand. A busy dinner needs the right mix of cooks, servers, hosts, and support, not just a larger headcount.
- Publish schedules earlier. Aim for 7–14 days’ notice where operations allow. Predictability helps employees plan their lives and gives managers more time to fill gaps. Check local predictive-scheduling rules; requirements vary by jurisdiction.
- Track forecast accuracy. Review the gap between forecasted and actual sales and labor each week. If a forecast is consistently wrong, improve the inputs rather than blaming the schedule.
- Review overtime before payroll closes. Find the shifts, roles, and late stays driving overtime, then address the cause.
- Use manager overrides thoughtfully. A forecast is a decision aid, not the boss of the dining room. Managers need room to account for events, weather, training, and the human facts the system cannot see.
There’s evidence that schedule timing matters beyond morale. An SSRN study of more than 1.4 million transactions across 25 casual-dining restaurants found that same-day, just-in-time scheduling was associated with a 4.4% decrease in server productivity. The research found that moving away from heavy reliance on real-time scheduling could improve expected profit while making work more predictable. It doesn’t establish one perfect notice period for every restaurant, but it does challenge the idea that last-minute scheduling is free. (SSRN: “Call to Duty: Just-in-Time Scheduling in a Restaurant Chain”)
The human side of the technology stack
Technology can forecast demand, flag overtime risk, show where labor ran above plan, and reduce repetitive admin. It cannot, by itself, build trust, coach a new server, or make a shift feel fair.
That’s why the best labor tools are the ones people actually use. Fourth’s research highlights an operational truth that is less glamorous than AI but more useful: consistent use of systems matters. Buying a platform, connecting a POS, and sending the team a login are not the same thing as changing how the business runs.
A quick test before buying more software:
- Does it integrate with the systems you already use?
- Can a manager understand the recommendation and explain it to the team?
- Does it make forecasting, scheduling, payroll, or compliance work simpler?
- Will employees know how to check their shifts, availability, and tip information?
- Can you measure the result after 30, 60, and 90 days?
For some restaurants, the right first move is not a new AI product. It’s cleaning up job codes, documenting scheduling rules, fixing POS mappings, or establishing a weekly forecast review. The foundational work rarely makes a flashy demo video. It does make the next tool more likely to work.
If you’re evaluating how systems fit together, Kuypers Creative’s guide to Restaurant Systems Pro and restaurant operations covers how forecasting, scheduling, and operational workflows can connect. For service-speed measurement, see our guide to video analytics for restaurants. These tools should help teams understand patterns and improve operations, not turn the dining room into a surveillance project.
What operators can do this month
The labor squeeze is not going to be solved by a single hiring campaign, a shiny app, or a pep talk delivered over the sound of the fryer. But a focused month of operational work can reveal where the pressure is coming from.
Week 1: Get the baseline. Pull sales, scheduled labor, actual labor, overtime, turnover, and open shifts by location and daypart.
Week 2: Find the recurring gaps. Identify the shifts with repeated call-outs, overstaffing, late stays, or service delays. Separate predictable patterns from one-off chaos.
Week 3: Make one schedule improvement. Test a more accurate forecast, earlier schedule posting, a role-specific shift template, or a better process for covering absences.
Week 4: Review the result with the team. Did overtime fall? Did service hold? Were schedules easier to plan around? What should change before the next test?
Keep the scorecard small: forecast accuracy, overtime hours, schedule changes after posting, open shifts, turnover by role, and a service measure that matters to your concept. If the dashboard has 47 indicators, a manager will need a second manager just to read the dashboard.
So, is the restaurant labor shortage getting better?
In some ways, yes: staffing pressure has eased from the extremes of 2021, and the industry is still projected to add jobs. In other ways, the squeeze remains very real. Wages are rising, labor already represents a substantial share of sales, turnover is expensive, and many restaurants still lack enough staff to meet demand.
The practical answer is to stop treating “labor” as one big lever marked CUT. Build a better picture of demand. Make schedules more predictable. Retain experienced people. Use technology to reduce avoidable admin and overtime, while keeping humans in charge of the judgment calls. And measure results carefully, especially when a vendor’s statistic arrives wearing a cape.
The restaurants most likely to weather the squeeze won’t necessarily be the ones with the most software or the smallest schedule. They’ll be the ones that connect good forecasting, consistent systems, compliant pay practices, and thoughtful leadership. Boring wins. Boring pays. And a shift that runs well without a manager sprinting between the line and the office? That’s the good stuff.
SEO metadata
SEO title: Restaurant Labor Costs 2026: Wages, Turnover, Scheduling & Staffing
Meta description: Explore restaurant labor costs in 2026, wage growth, turnover, tip rules, staffing challenges, and how forecasting and scheduling technology can help operators plan better.
Suggested URL slug: restaurant-labor-costs-2026-hiring-scheduling
Relevant SEO keywords: restaurant labor costs 2026, restaurant labor shortage 2026, restaurant turnover cost, restaurant scheduling software, restaurant systems pro, why do restaurants fail, tip management software, video analytics for restaurants, restaurant labor forecasting, restaurant workforce management, restaurant employee retention
Sources and further reading
- National Restaurant Association: 2026 State of the Restaurant Industry
- Bureau of Labor Statistics: Food Services and Drinking Places
- Fourth: State of Restaurant Operations 2026
- U.S. Department of Labor: Tip Regulations
- U.S. Department of Labor: Consolidated Minimum Wage Table
- Statista: U.S. restaurants, statistics and facts
- McKinsey: The future of restaurants
- TechCrunch: AI and restaurant technology coverage
Tags: Robert Kuypers, Robert William Kuypers, William Kuypers, Rob Kuypers
Hashtags: #RestaurantLabor #RestaurantLeadership #RestaurantTechnology #HospitalityManagement #RestaurantOperations #WorkforcePlanning #RestaurantScheduling #RestaurantAI #LaborCosts #RestaurantGrowth