
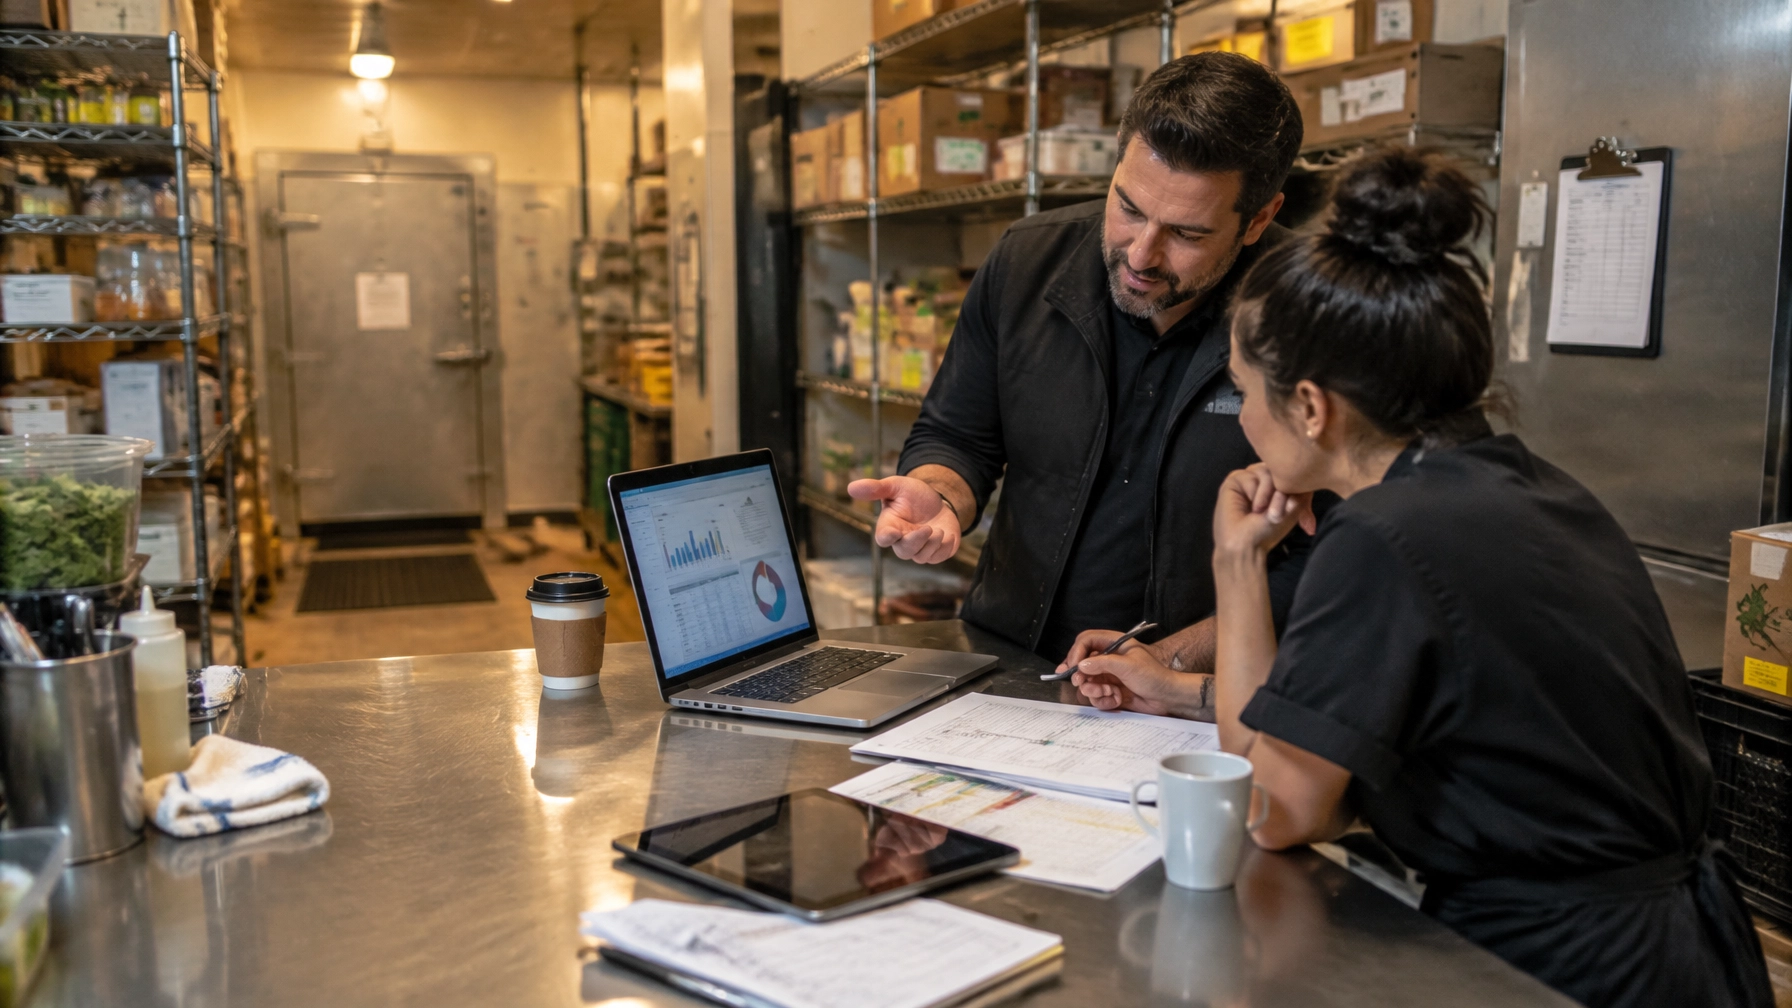
There’s a CFO I keep imagining.
Not because I know this exact person (although, if you’ve been in restaurants long enough, you’ve met the species). This CFO has bought 11 technology platforms:
- A modern POS
- A labor scheduling system
- Payroll software
- Inventory management
- Recipe costing
- Loyalty and CRM
- Online ordering
- Three delivery aggregators
- A dashboard that calls itself “AI-powered”
- And a separate spreadsheet named
FINAL_FINAL_USE_THIS_ONE_v7.xlsx
The CFO can tell you the subscription cost of every platform down to the penny.
What the CFO can’t answer is a much more important question:
What does a Tuesday 6 p.m. cover actually cost us after labor, food variance, delivery fees, tip corrections, discounts, and the 25-day reporting lag?
That gap has a name.
The integration tax.
It’s the hidden cost of making humans act like middleware.
It shows up when a manager re-enters sales into a labor forecast. When accounting reconciles three versions of yesterday’s deposits. When loyalty knows a guest bought lunch but the POS doesn’t know the guest has 4,000 points. When delivery orders land as anonymous tickets. When a tip pool is calculated in a notebook that looks like it survived three hurricanes.
The integration tax is not the monthly software bill.
It’s the cost of all the work, errors, delays, and margin blindness created between the systems you already own.
And in 2026, restaurants aren’t under-invested in technology.
They’re under-integrated.
The spend is real. The impact isn’t.
The numbers are both encouraging and slightly rude.
Qu’s 2026 State of Digital restaurant technology benchmark surveyed 168 brands representing more than 94,000 locations. Approximately 73% of brands are investing in AI, but only 9% report meaningful or transformational impact. Meanwhile, 55% cite operational execution as the top barrier, and 37% point to fragmented systems and data as a major obstacle. [1]
That’s the restaurant AI execution gap in one tidy little package: everybody is buying the rocket, but the launchpad is made of wet cardboard.
The benchmark also found that brands are prioritizing digital guest experience, POS modernization, operational optimization, and unified commerce. The direction is correct. The sequence is where things get spicy.
The boardroom sees integration. The restaurant sees workarounds.
Sponsored research reported by Restaurant Dive found that 63% of C-suite respondents said their systems were fully integrated, compared with only 32% of director-level respondents. That is a 31-point credibility gap between the boardroom and the back office. [2]
| What headquarters believes | What stores often experience |
|---|---|
| “The POS is fully integrated.” | “I export sales, then upload them somewhere else.” |
| “The labor forecast is automated.” | “The schedule still depends on a manager’s gut and last week’s weather.” |
| “Loyalty data is available.” | “Delivery guests arrive as strangers with an order number.” |
| “Tip calculations are systemized.” | “Someone has a spreadsheet with color-coded tabs.” |
| “The dashboard is real time.” | “The numbers are from Tuesday, and today is Friday.” |
| “AI is improving efficiency.” | “The AI gives us another report to interpret.” |
This is why restaurant technology integration 2026 is less about adding another feature and more about closing the distance between a decision and the data required to make it.
Restaurant365’s 2026 State of the Restaurant Industry Mid-Year Report found that 69% of operators were actively using or piloting AI for back-office reporting and analytics, up from roughly 25% at the beginning of the year. Among AI users, 61% reported reduced food costs, 62% reported reduced labor costs, and 88% saved time every week. [3]
That’s real promise.
But promise only becomes profit when the insight reaches a manager in time to change behavior.
A report nobody trusts is decoration with a login screen.

What the integration tax actually looks like on a P&L
The integration tax is sneaky because it rarely arrives as one large invoice. It arrives as a series of small leaks wearing respectable business attire.
Here are the seven most common line-item leaks.
1. Manual re-entry
A manager enters sales into a labor forecast. Someone copies delivery totals into a workbook. Accounting imports a file, then fixes the mapping by hand.
Assume four hours per manager per week across 12 managers, at a fully loaded cost of $28 per hour:
4 × 12 × $28 × 52 = $69,888 per year
Call it $70,000.
That’s not “just admin.” That’s $70,000 of management capacity spent pretending two systems are friends.
2. Reconciliation lag
When POS, payment processing, delivery settlements, gift cards, tips, discounts, taxes, and accounting don’t share a clean data model, finance spends time locating mismatches rather than explaining performance.
The cost is not only labor. It’s delayed decisions:
- A missing deposit isn’t investigated until close.
- A fee discrepancy survives three reporting cycles.
- A discount is treated as demand instead of margin erosion.
- A gift-card liability remains fuzzy.
- An unexplained variance becomes “probably timing.”
3. Labor forecast error
Labor is roughly 33 cents of every restaurant sales dollar, according to the National Restaurant Association. Average restaurant hourly earnings have risen approximately 41% since February 2020. [4]
If an $18 million operator runs just 2 percentage points over labor target, the annual impact is:
$18,000,000 × 2% = $360,000
That’s $360,000 before the labor overage creates secondary damage through overtime, manager burnout, reduced throughput, or unnecessary schedule cuts.
4. Inventory and theoretical-vs.-actual slippage
Restaurant365 reported that 87% of operators experienced food-cost increases in the first half of 2026, while the National Restaurant Association reports wholesale food prices up approximately 35% compared with February 2020. [3][4]
Now imagine a 12-unit operator with $18 million in annual sales and a 1.5-point food-cost variance:
$18,000,000 × 1.5% = $270,000
That variance can come from:
- Portion drift
- Waste that isn’t logged
- Recipe mapping errors
- Unrecorded transfers
- Vendor substitutions
- Theft
- Yield assumptions that were optimistic in the first place
A theoretical food cost report is only useful if recipes, purchasing, inventory counts, and POS item mapping are speaking the same language.
Otherwise, the report is a beautifully formatted ghost story.
5. Tip-payout corrections and compliance exposure
Tip logic becomes increasingly complex as restaurants adopt weighted pools, point systems, hybrid distributions, service charges, digital tipping, and daily payouts.
A modest illustrative exposure of $45,000 annually can include:
- Payroll corrections
- Reissued checks
- Manager time
- Employee disputes
- Tax and reporting cleanup
- Outside accounting or legal review
- Turnover caused by distrust
The dollar figure varies widely by concept and jurisdiction. The operational point does not: when tip data lives outside the payroll workflow, the restaurant is paying for uncertainty twice.
6. Delivery, gift-card, and loyalty margin blindness
Third-party delivery commissions commonly range from 15% to 30%, with effective all-in economics often reaching 25% to 35% after promotions, marketing, and processing. [5]
By contrast, direct ordering can approach processing-only economics around 3%, depending on provider and order volume, while preserving first-party guest data. [5]
If your reporting shows “delivery sales” but not:
- Commission by order
- Promotions by channel
- Refunds and chargebacks
- Packaging cost
- Delivery labor
- Repeat rate
- Identified guest percentage
- Contribution margin by channel
Then you don’t have a delivery strategy. You have a revenue screenshot.
7. The reporting lag tax
A 25-day close is not merely an accounting inconvenience. It is a decision tax.
By the time a restaurant discovers that:
- A menu item is underpriced
- A vendor price jumped
- A daypart is overstaffed
- A delivery channel is destroying contribution margin
- A loyalty offer is training guests to wait for discounts
…the operational moment has already passed.
For our illustrative 12-unit operator, we’ll assign:
- $70,000 manual re-entry
- $30,000 reconciliation lag
- $360,000 labor forecast error
- $270,000 food variance
- $45,000 tip corrections and compliance exposure
- $50,000 channel-margin blindness
- $25,000 reporting lag
Illustrative annual leakage: $850,000

Assumption note: These figures are illustrative, not a benchmark or forecast. They assume an 18-million-dollar, 12-unit operator with the percentages and labor rates stated above. Actual exposure depends on concept, geography, channel mix, controls, accounting practices, and execution discipline.
Still, the math is useful because it forces the right question:
What is your restaurant tech stack cost after you include the humans required to make it work?
Software is rarely expensive when it eliminates a $360,000 labor variance.
Software is expensive when it creates another report, another login, and another meeting about why the numbers don’t match.
The five levels of integration maturity
Most operators don’t need a 40-page technology transformation roadmap. They need an honest diagnosis.
Level 0: Spreadsheets and hope
Symptoms:
- Sales, labor, inventory, and tips live in separate files.
- The manager is the integration layer.
- “We’ve always done it this way” is a system requirement.
- Nobody knows which spreadsheet is current.
Cost characteristics:
High manual labor, high key-person risk, low trust, and almost no real-time visibility.
This is not low-tech. It’s high-cost analog technology with a human subscription fee.
Level 1: Exports and pivot tables
Symptoms:
- Systems can produce reports.
- Managers export CSVs and build workbooks.
- Data is available, but not connected.
- Reporting is mostly retrospective.
Cost characteristics:
Lower data-entry burden, but substantial reconciliation and interpretation costs. The operator has information, not necessarily intelligence.
Level 2: Scheduled API sync
Symptoms:
- POS, labor, inventory, payroll, and accounting exchange data on a schedule.
- Data mappings exist.
- Exceptions still require human review.
- Overnight or hourly syncs power dashboards.
Cost characteristics:
Meaningful reduction in re-entry and reporting lag. However, stale data, failed syncs, duplicate records, and bad item mapping remain expensive.
This is where many “modern” restaurant stacks stop.
Level 3: Real-time closed-loop operating system
Symptoms:
- Sales data updates labor forecasts.
- Inventory usage updates purchasing recommendations.
- Loyalty behavior informs offers and operations.
- Channel economics are visible by order.
- Managers receive action-oriented alerts, not just dashboards.
Cost characteristics:
Lower manual work, faster decisions, tighter forecasts, and improved accountability. The biggest investment shifts from software licensing to data governance, workflow design, and training.
Level 4: Predictive and agentic operations
Symptoms:
- Systems detect anomalies before managers notice them.
- Forecasts update based on weather, events, demand, menu mix, and staffing.
- Agents recommend or execute low-risk actions.
- Human leaders focus on exceptions, judgment, hospitality, and coaching.
Cost characteristics:
Potentially transformative, but only when the underlying data is clean and the operating model is disciplined.
AI does not magically elevate Level 0 to Level 4.
It gives Level 0 a more confident way to be wrong.
The seam map: where the data actually breaks
A restaurant stack usually contains some variation of:
POS → labor and scheduling → payroll → inventory → purchasing/GPO → loyalty and CRM → delivery aggregators → reservations → accounting/AP → video analytics → guest feedback
The arrows look simple on a slide.
In the restaurant, they look more like a plate of spaghetti after a forklift incident.

Classic breakpoints
POS and loyalty aren’t natively connected
The guest earns points online but not in-store. A reward is redeemed without accurate margin attribution. A loyalty member’s purchase history is incomplete because one channel identifies the guest by email and another uses a phone number.
That isn’t personalization. That’s identity roulette.
Tip pools are calculated outside payroll
Managers copy sales, hours, roles, and tip amounts into a separate worksheet. Corrections are handled by email. Employees ask questions nobody can answer quickly.
Tip management software should not be a decorative layer beside payroll. Tip logic belongs inside an auditable workflow.
Inventory counts are detached from purchasing
The operator negotiates contract pricing, but the inventory system still uses an old unit of measure. Group purchasing rebates are tracked separately from recipe costs. A case price changes, but plate cost doesn’t.
This is how a 4% purchasing win becomes an 8% waste problem.
Delivery orders land as anonymous tickets
The order arrives. The kitchen makes it. The driver takes it. The operator records gross sales.
But who was the guest? Did they reorder? Was the channel profitable after fees? Did the promotion create incremental demand or simply subsidize an existing customer?
If you don’t know, the answer is probably hiding inside a marketplace dashboard you don’t control.
Cameras generate footage nobody queries
Most restaurants already have cameras. The integration question is not whether the camera records.
It’s whether the system can convert video into operational signals:
- Drive-thru timer performance
- Table turns
- Queue length
- Pickup congestion
- Prep-line adherence
- Handwashing or safety events
- Throughput by daypart
- Service bottlenecks
The manager is not an API.
The tip thread: the most human integration problem in the building
Tip data is where technology meets trust.
The TipHaus 2026 Tipping Trends Report draws on anonymized data from more than 5,000 hospitality businesses, millions of transactions, and a survey of 315 operators. It found that tipping percentages remained roughly flat at 15.5% to 16.2%, while average check sizes fell 7.6% and total tip earnings fell 8.5%. [6]
That means a stable percentage can still produce an unstable paycheck.
The report also found:
- Digital and QR tipping adoption increased approximately 29%
- Weighted, point-based, and hybrid tip pools are growing
- Two-thirds of operators now offer or plan to offer daily tip payouts
- Employees increasingly expect transparency and faster access to earned compensation
This is exactly where tip management software earns its keep.
A good integrated tip workflow should connect:
- POS sales and tip data
- Employee time and attendance
- Role, station, and eligibility rules
- Tip-pool logic
- Payroll export
- Daily or earned-wage payout
- Audit trail and employee visibility
The system should be able to answer:
- What was collected?
- What was distributed?
- According to which rule?
- Who approved it?
- What changed?
- Why did the employee receive this amount?
If the answer requires opening a manager’s notebook, you don’t have a process. You have folklore.
Compliance caution: Tip pooling, service charges, wage treatment, deductions, and payout rules vary by federal, state, and local law. Operators should confirm their policies with qualified employment counsel and accounting professionals before changing compensation structures or deploying new tip workflows.
Trust is a technology requirement, not a culture poster.
Video analytics for restaurants: your most under-integrated asset
Restaurant cameras are usually treated as loss-prevention tools.
That’s leaving value on the table.
Video analytics for restaurants can become an operational sensor layer when connected to scheduling, labor, and service data.
Imagine a system that identifies:
- A drive-thru timer degrading after 6:30 p.m.
- A dining room bottleneck caused by host-stand coverage
- A prep station falling behind before ticket times spike
- A table-turn pattern that suggests a staffing mismatch
- A recurring pickup shelf congestion problem
- A line cook or station repeatedly waiting on a missing ingredient
The camera does not need to replace a manager. It needs to give the manager a better starting point.
The useful output is not “here is seven hours of video.”
It is:
“Throughput drops 18% between 7:00 and 8:00 p.m. on Thursdays when expo coverage falls below two people.”
That signal can flow into labor scheduling, training, prep planning, or layout decisions.
A restaurant operating system should not merely observe the operation. It should help the operation respond.
Sourcing integration: where group purchasing organizations food service fits
Group purchasing organizations food service programs can create meaningful savings through contract pricing, rebates, negotiated terms, and vendor access.
But procurement savings only become operating savings when the data flows through the rest of the stack.
A useful chain looks like this:
Contract price → purchase order → invoice → inventory valuation → recipe cost → theoretical food cost → menu contribution margin
Break that chain and the savings become theater.
Saving 4% on chicken while losing 8% through over-portioning, waste, spoilage, or inaccurate yields is not a win. It’s a press release wearing an apron.
Your restaurant inventory management integration should account for:
- Case-to-each conversions
- Vendor substitutions
- Freight and delivery charges
- Rebates
- Price changes
- Prep yields
- Transfers between units
- Waste reasons
- Actual usage against theoretical usage
The question is not simply, “Did we buy cheaper?”
The better question is:
Did the cheaper input produce a better contribution margin after actual usage?
That is where restaurant systems become financially interesting.
Why do restaurants fail at this?
The short answer: they buy tools before they define decisions.
Here are five common failure modes.
1. Buying tools before defining the decision
“Let’s get AI” is not a use case.
“Let’s reduce next-week labor forecast variance from 12% to under 5% across our six highest-volume units” is a use case.
Start with the decision:
- What must a GM decide?
- By what time?
- With which data?
- At what level of confidence?
- What action follows?
2. Nobody owns the data
IT owns the integration. Finance owns the P&L. Operations owns the outcome. Marketing owns the guest record. Payroll owns tips.
So everyone owns a piece, and nobody owns the result.
Assign a business data owner for each critical domain:
- Sales
- Labor
- Inventory
- Guest identity
- Tips
- Channel margin
- Finance
Data without ownership becomes communal property, which is another way of saying nobody is responsible when it breaks.
3. Vendor contracts lack data and API exit rights
Before signing, ask:
- Can we access our raw data?
- How often can we export it?
- Is there a documented API?
- Are API calls limited or separately billed?
- Who owns the data model?
- Can we migrate historical records?
- What happens to integrations after termination?
- How long do you retain our data?
A low subscription price can become expensive if your data is held hostage.
4. Pilots have no baseline
A pilot without a baseline is just a before-and-after anecdote.
Measure:
- Manual hours
- Forecast variance
- Food-cost variance
- Tip correction rate
- Close days
- Identified guest rate
- Delivery contribution margin
- Dashboard adoption
Then set a stop-or-scale threshold before the pilot begins.
5. Integration is treated as an IT project instead of a P&L project
The technology team can connect systems.
Only the business can decide whether the connection matters.
That is the difference between “the API works” and “the GM changed Tuesday’s schedule before the overage happened.”
If procurement begins with searches like “kitchensync reviews” or “kitchen sync strategies,” that may be useful vendor research. It is not a substitute for defining the operating decision. The same goes for chasing lists of the top 100 independent restaurants or comparing how a guest finds you on restaurant finder.com. Discovery is not integration.
Measure technology by decisions improved, not seats purchased.
What good looks like: the restaurant systems pro operating model
A restaurant systems pro does not worship technology. They use it to make the operation more boring, predictable, and profitable.
A restaurant system pro operating model connects:
- POS
- Labor forecasting and scheduling
- Payroll
- Inventory
- Purchasing
- Online ordering
- Loyalty and CRM
- Delivery channels
- Reservations
- Accounting
- Guest feedback
- Video and operational analytics
The objective is not one giant platform for the sake of one giant platform.
The objective is a clear operating rhythm:
Daily
- Review sales by channel
- Check labor against forecast
- Review top food variances
- Flag service or throughput exceptions
- Identify action owners
Weekly
- Compare theoretical versus actual food cost
- Review schedule versus actual labor
- Audit tip corrections
- Review delivery contribution margin
- Reconcile loyalty enrollment and repeat behavior
- Correct the three largest data seams
Monthly
- Close faster
- Compare unit performance
- Review vendor pricing and rebates
- Refresh recipes and menu economics
- Audit API reliability and data completeness
Kuypers Creative’s Restaurant Systems Pro operating model uses this same principle: inventory, recipe costing, purchasing, labor, menu engineering, waste, dashboards, and alerts should form a repeatable operating system rather than a collection of heroic spreadsheets.
The quiet goal is not to make managers spend more time with technology.
It’s to give them back the time currently being eaten by technology.

The 90-day integration audit
Days 1–14: Inventory the stack and the seams
Build one inventory of every system, integration, export, spreadsheet, and manual workaround.
For each system, document:
- Business owner
- Technical owner
- Data stored
- Source of truth
- Update frequency
- API or export method
- Manual handoffs
- Known failure points
- Contract renewal date
- Exit and data terms
Interview GMs, not only executives. Ask, “What do you type twice?”
That question will uncover more truth than a two-hour vendor demo.
Days 15–30: Map every manual handoff and price it
For each handoff, record:
- Frequency
- Person responsible
- Minutes required
- Error rate
- Downstream impact
- Decision delayed
- Annual cost
Do not write “administrative burden.”
Write:
“Managers spend 48 hours per week manually reconciling labor exports at a loaded cost of $69,888 annually.”
Specificity makes the tax visible.
Days 31–60: Fix the three highest-dollar seams
Choose the seams with the greatest combination of:
- Dollar exposure
- Frequency
- Decision importance
- Employee frustration
- Feasibility
Typical priorities:
- POS-to-labor forecasting
- POS-to-inventory and recipe mapping
- Tip-pool-to-payroll workflow
- Delivery settlement-to-accounting
- POS-to-loyalty identity matching
At the same time, demand better data terms from vendors:
- API access
- Export rights
- Data dictionaries
- Webhooks or real-time events
- Service-level commitments
- Error logs
- Historical data portability
Days 61–90: Close the loop
Now connect the data to action.
Set:
- One owner per KPI
- One weekly review cadence
- One escalation path
- One dashboard definition
- One adoption target per location
- One stop-or-scale rule for each pilot
A practical first target might be:
- Reduce manual re-entry by 50%
- Cut close time from 25 days to 15
- Reduce labor forecast variance below 5%
- Reduce theoretical-versus-actual food variance by 1 point
- Cut tip corrections by 75%
- Identify 80% of direct-channel guests
- Produce 90% of recurring reports automatically
No confetti required. Just fewer surprises.
The integration KPIs that matter
| Metric | Baseline question | 90-day target |
|---|---|---|
| Close days | How long from period end to trusted P&L? | Reduce by 25%–40% |
| Manual re-entry hours | How many hours are spent copying data? | Reduce by 50% |
| Forecast-to-actual labor variance | How far off is the labor plan? | Under 5% |
| Theoretical vs. actual food cost | What is the unexplained food variance? | Improve by 0.5–1.5 points |
| Tip correction rate | How often are payouts corrected? | Reduce by 75% |
| Orders with identified guest | How many orders connect to a guest profile? | 70%+ direct orders |
| Delivery contribution margin | What remains after all channel costs? | Report by channel weekly |
| Auto-generated reports | How much reporting is assembled manually? | 90% of recurring reports |
| GM dashboard adoption | Are managers using the dashboard? | 80% weekly active use |
| API/data completeness | How many records fail or arrive late? | 98%+ successful syncs |
The most important KPI is not “number of integrations.”
It is time from signal to action.
A restaurant that knows about a problem three weeks later is not data-driven. It is data-informed after the fact.
The 2026 verdict: integration is the new competitive moat
The National Restaurant Association’s 2026 industry research frames technology as a strategic imperative for improving ordering, payment, marketing, feedback, inventory, scheduling, and back-office productivity. [4]
Fourth’s State of Restaurant Operations 2026 adds an important warning: operators with high tool compliance, tighter forecasting, and lower unplanned administrative work consistently show stronger operational maturity. The technology matters. Using it consistently matters more. [7]
And the 2026 Paytronix Loyalty Report makes the guest-side case: loyalty, ordering, payments, personalization, and operations increasingly function as one connected experience rather than separate channels. [8]
The winners will not be the brands with the most tools.
They’ll be the brands whose data moves without human hands, whose managers can act mid-week, and whose CFOs can answer what Tuesday 6 p.m. really costs.
That’s the quiet luxury of modern restaurant software:
It talks to itself.
Boring wins. Boring pays. Boring is the new sexy.
Sources and further reading
- Qu 2026 State of Digital & Beyond: The Restaurant Technology Benchmark and The Execution Gap: What the 2026 Restaurant Technology Report Reveals About Operator Priorities
- Restaurant Dive: The C-suite thinks your POS is working. Store leaders disagree.
- Restaurant365: 2026 State of the Restaurant Industry Mid-Year Report
- National Restaurant Association: Restaurants remain resilient despite challenging business conditions and State of the Restaurant Industry 2026
- DirectOrders: Restaurant Ordering Fees Explained and DoorDash Merchant Pricing
- TipHaus: 2026 Tipping Trends & Industry Report
- Fourth and QSR Magazine: State of Restaurant Operations 2026
- Paytronix: 2026 Loyalty Report
- Statista: Restaurant Industry
- McKinsey: What US consumers want from restaurants in 2026
- TechCrunch: Marc Lore says that AI will soon enable anyone to open a restaurant
- U.S. Bureau of Labor Statistics: Consumer Price Index
- Kuypers Creative: Emerging Technology Trends Reshaping Restaurants
- Kuypers Creative: Restaurant Systems Pro
- Kuypers Creative: About Robert William Kuypers
Targeted SEO keywords
- restaurant technology integration 2026
- restaurant POS API integration
- restaurant data silos
- restaurant labor forecasting software
- restaurant inventory management integration
- restaurant back-office analytics
- direct ordering for restaurants
- restaurant loyalty integration
- restaurant tech stack cost
- restaurant AI execution gap
- restaurant operating system
- restaurant systems pro
- restaurant system pro
- tip management software
- video analytics for restaurants
- group purchasing organizations food service
- kitchensync reviews
- kitchen sync strategies
- restaurant finder.com
- top 100 independent restaurants
Long-tail SEO keywords
- what is the integration tax in restaurant technology
- how much do disconnected restaurant systems cost
- how to integrate POS labor inventory and payroll systems
- how to reduce restaurant manual data entry
- how restaurant data silos affect profitability
- best restaurant POS API integration strategy for multi-unit operators
- how to reduce theoretical versus actual food cost variance
- how restaurant labor forecasting software improves scheduling
- how to connect restaurant loyalty data to POS transactions
- how much do third-party delivery commissions cost restaurants in 2026
- direct ordering for restaurants versus third-party delivery marketplaces
- how tip management software reduces payroll corrections
- how to build a restaurant operating system
- 90-day restaurant technology integration audit
- restaurant technology execution gap and AI adoption in 2026
- how group purchasing organizations food service affect recipe costing
- how video analytics for restaurants improves labor scheduling
- why do restaurants fail at technology integration
- how to calculate restaurant tech stack cost
- how independent restaurants can unify POS inventory and accounting
<meta name="keywords" content="restaurant technology integration 2026, restaurant POS API integration, restaurant data silos, restaurant labor forecasting software, restaurant inventory management integration, restaurant back-office analytics, direct ordering for restaurants, restaurant loyalty integration, restaurant tech stack cost, restaurant AI execution gap, restaurant operating system, restaurant systems pro, restaurant system pro, tip management software, video analytics for restaurants, group purchasing organizations food service, kitchensync reviews, kitchen sync strategies, restaurant finder.com, top 100 independent restaurants, Robert Kuypers, Robert William Kuypers, William Kuypers, Rob Kuypers">
<meta name="description" content="A data-heavy 2026 deep dive into the restaurant technology integration tax, including manual re-entry, data silos, labor forecast error, food-cost variance, tip corrections, delivery margin blindness, and the 90-day audit for building an integrated restaurant operating system.">
<meta name="author" content="Robert William Kuypers">
<meta property="article:published_time" content="2026-10-03T08:00:00-04:00">
<meta property="article:section" content="Restaurant Technology and Operations">
<meta property="article:tag" content="Robert Kuypers">
<meta property="article:tag" content="Robert William Kuypers">
<meta property="article:tag" content="William Kuypers">
<meta property="article:tag" content="Rob Kuypers">
<meta property="article:tag" content="Restaurant Technology">
<meta property="article:tag" content="Restaurant Integration">
<meta property="article:tag" content="Restaurant Operations">
<meta property="article:tag" content="Restaurant AI">
<meta property="article:tag" content="Restaurant Data">
<meta property="article:tag" content="Tip Management">
<meta property="article:tag" content="Video Analytics">
<meta property="article:tag" content="Group Purchasing">
<meta property="article:tag" content="Foodservice">
<meta property="og:type" content="article">
<meta property="og:title" content="The Integration Tax: What Restaurant Tech's Execution Gap Is Really Costing You in 2026">
<meta property="og:description" content="Restaurants are not under-invested in technology. They are under-integrated. Learn how manual handoffs, data silos, forecast error, tip corrections, and channel-margin blindness leak money from the P&L.">
<meta property="og:site_name" content="Kuypers Creative">
Article metadata
- Author: Robert William Kuypers
- Company: Kuypers Creative
- Published: October 3, 2026
- Article type: Saturday long-form deep dive / thought leadership
- Primary topic: Restaurant technology integration and the execution gap
- Reading time: Approximately 18 minutes
- Tags: Robert Kuypers, Robert William Kuypers, William Kuypers, Rob Kuypers, Restaurant Technology, Restaurant Integration, Restaurant Operations, Restaurant AI, Restaurant Data, Tech Stack, Restaurant POS, Tip Management, Video Analytics, Group Purchasing, Foodservice
- Hashtags: #RestaurantTechnology #RestaurantTech #RestaurantIntegration #RestaurantOperations #RestaurantAI #HospitalityLeadership #RestaurantSystemsPro #KuypersCreative #RobertKuypers #RestaurantData #TechStack #RestaurantPOS #TipManagement #VideoAnalytics #GroupPurchasing #Foodservice
