
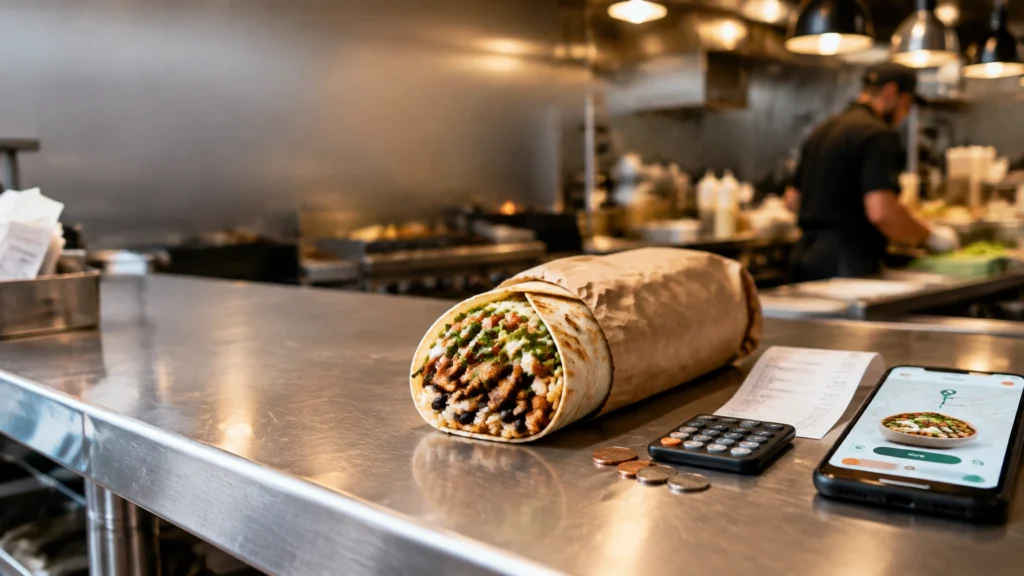
A burrito leaves your kitchen wrapped in foil, snug in a bag, and headed for someone’s sofa. The guest paid $40. The app may have kept $10, the courier got paid to bring it, and your restaurant still has to account for ingredients, packaging, labor, refunds, promotions and the delightful little gremlins hiding in overhead.
So, who made money?
The honest answer: you cannot tell from the order total, or from the marketplace commission alone. A delivery order can grow sales while shrinking contribution. And “we’re busy” is not the same thing as “we’re profitable.” One is a feeling. The other should survive a spreadsheet.
Off-premise dining (takeout, delivery and drive-thru) is now a major part of the restaurant business. The National Restaurant Association’s 2025 report put off-premise at nearly 75% of restaurant traffic. That’s a useful benchmark for the 2026 planning conversation, but remember: off-premise is not the same as third-party delivery. It also includes takeout and drive-thru, channels with very different economics.
Meanwhile, delivery is a serious global business. Euromonitor reported that delivery represented 22% of global consumer-foodservice spending in 2025. The market is not going away. The question is whether your restaurant’s slice of it is worth serving.
First, the commission math: what happens to a $40 order?
Delivery apps charge restaurants for access to their marketplace and, depending on the plan, services such as delivery, customer support or promotion. Published fees vary by plan and market. In broad terms, DoorDash’s listed restaurant delivery plans run from 15% to 30%; Uber Eats lists Lite at 20%, Plus at 25% and Premium at 30%. Grubhub’s published plans range from a 5% marketing option to higher-commission plans, with delivery and processing costs handled separately. FoodyOS’s 2026 fee comparison summarizes the published schedules.
Those percentages are not the whole cost of delivery. Ads, promotions, refunds, processing, device charges, delivery arrangements and pricing decisions can add to the bill. OPA! Research’s 2026 analysis, based on fee statements from 127 multi-unit operators, reported a 23% weighted-average effective commission in its sample. That’s a useful operator benchmark, not a universal industry average. Some restaurants can face an all-in burden around 30% or more, depending on the plan and what gets layered on. Chowly’s 2026 comparison describes scenarios where the effective cost can reach 30–40%.
Now the menu math.

A $40 order, with the assumptions shown
The following is illustrative, not a quote from any platform. Assume a $40 food subtotal and compare three channel costs before food, packaging, labor, taxes, tips, refunds, promotions or fixed overhead:
| Order path | Assumed channel cost | Amount remaining before food and other costs |
|---|---|---|
| Marketplace at 25% commission | $10.00 | $30.00 |
| Marketplace at 30% commission | $12.00 | $28.00 |
| Direct order, restaurant pays an illustrative $8 delivery subsidy | $9.46* | $30.54 |
*The direct-order example assumes 2.9% + $0.30 card processing on $40 ($1.46), plus an $8 restaurant-paid delivery subsidy. Actual processor, software and courier arrangements vary. A customer-paid delivery fee could reduce or eliminate the restaurant’s subsidy; a restaurant-funded discount could increase it.
That last column is not profit. It is what remains after the simplified channel costs, before the order’s food and operating costs. A third-party commission may cover services beyond payment processing, while a direct order may require the restaurant to arrange delivery, attract the guest, and support its own ordering platform. The example is a starting point for a fair comparison, not proof that direct is automatically cheaper in every situation.
Consider a simple food-cost illustration: if the ingredients for this order cost $12, then the marketplace examples leave $18 and $16 before packaging, labor and the rest. The direct-order example leaves $18.54 before those same costs. Change the delivery subsidy, card-processing contract or menu price and the result changes. That is the point: price each channel with your own numbers.
McKinsey’s analysis of food delivery explains why marketplaces have several revenue streams, including restaurant commissions, consumer fees and in-app advertising. The restaurant is not necessarily paying one neat fee for one neat service. And the guest’s delivery fee is not automatically the same thing as the restaurant’s commission.
Why 30% can be a margin-eating dragon
Many restaurants operate on thin net margins. Restaurant365’s channel-profitability guide makes the essential point: compare order modes after factoring in selling price, item cost, fees and other costs, not sales volume alone.
For perspective, a restaurant earning a 3–6% net margin on $40 would make roughly $1.20–$2.40 in net profit. A $10–$12 platform commission is several times that amount. It does not mean every delivery order loses money: a commission is not a net-margin calculation, and incremental sales can contribute toward fixed costs. It does mean that a restaurant cannot casually assume the order is profitable because the register rang.
Before you declare victory, account for the whole order: food cost, packaging, incremental labor, delivery fees or subsidy, discounts, refunds, payment processing, advertising and how much of the sale was truly incremental. If the order replaced a higher-margin pickup or dine-in order, that matters too.
Sales are the entrance. Contribution is the room you’re trying to get into.
The hybrid playbook: rent discovery, own the relationship
Nearly half of surveyed operators-46%, reported using a mix of first-party and third-party ordering in TouchBistro’s 2026 American State of Restaurants report. That hybrid approach makes sense when each channel has a job.
Think of the marketplace as a discovery and convenience channel. A new guest searches nearby, sees your menu, and tries the restaurant. Your owned channels (your website, app, email, loyalty program and text messages) are where you work to earn a repeat visit and build a direct relationship.
A practical mix might look like this:
- Use marketplaces to reach guests who may not know you. Track what each platform brings in and what it costs; don’t pay blindly for every possible upsell.
- Make direct ordering easy to find. Put a clear “Order direct” link on your website, Google Business Profile, social profiles, receipts and pickup packaging.
- Give guests a good reason to order direct next time. Convenience, a loyalty benefit, an exclusive bundle or a smoother experience can work. A guilt trip about commissions is not a customer-value proposition.
- Capture useful guest data with permission. A direct transaction can help build a first-party relationship, but data access and use depend on your technology, contracts and consent practices. Read the terms. “We own the data” is not a strategy if you can’t export it.
- Measure channel contribution, not just channel sales. A $100 marketplace order and a $100 direct order are not economically identical if one carries a larger fee or a delivery subsidy.
This is where brand, menu design and digital marketing meet operations. Kuypers Creative’s digital marketing and funnel strategy resources and technology and innovation articles address the systems and guest journey behind those choices. Because if your direct-order button is buried like treasure with no map, guests will take the easy road. They’re hungry, not completing an escape room.
Direct ordering has a margin advantage. It still has to work.
Here’s the 2026 wrinkle: the PAR Technology 2026 QSR Operational Index reported that mobile first-party ordering transactions dipped 2.9%. That finding is specific to the report’s QSR data; it does not establish that every restaurant’s direct orders fell.
The bigger lesson is that a lower fee does not automatically produce more orders. First-party ordering has to earn attention and repeat use. A marketplace may already have the customer’s app, payment details, saved address and search habit. Your restaurant app has to persuade someone to download it, remember it, sign in, navigate it and find a reason to return.
And then the technology has to behave. Qu’s 2026 State of Digital benchmark surveyed 168 brands representing roughly 91,000 locations. It found 57% ranked digital guest experience as a top technology investment and 48% expected to increase tech spend. Yet respondents also cited operational execution and fragmented systems as barriers. In its survey, third-party ordering was the most commonly identified area of system instability, followed by first-party ordering.
That friction is not an abstract IT problem. It’s a guest abandoning a cart, an order appearing twice, a menu item showing as available after it sold out, or a team member trying to reconcile three tablets during the dinner rush. The Deloitte restaurant-futures study also emphasizes the role of digital and automated experiences in restaurant service. The goal is not to bolt on technology because it looks modern. It is to make ordering, payment, pickup and service feel easier, and make the operation more reliable.
If you are considering direct online ordering for restaurants, test the whole path on a phone: discover the restaurant, choose an item, customize it, pay, get an accurate pickup or delivery promise, and receive the order. A shiny app with a broken checkout is just expensive digital wallpaper.
The menu-price squeeze, and the guest’s value calculator
Restaurant menu prices rose 3.5% year over year in September 2026, according to the Bureau of Labor Statistics’ CPI release, as summarized by the National Restaurant Association’s menu-price indicator. Limited-service prices were up 3.2%; full-service prices were up 3.8%. Grocery prices rose 1.8% over the same 12-month period.
That difference does not mean restaurants can simply raise prices without consequence. Guests compare the final bill with the food, convenience and experience they receive. Then delivery can add a marketplace price, delivery fee, service fee, tip or other charges on top. The burrito that looked like a $14 lunch can look a lot less charming at checkout.
This is why delivery pricing needs a deliberate value story. Review whether the menu travels well, whether packaging protects quality, whether portions and bundles make sense, and whether your app and marketplace menus show clear descriptions and accurate prices. A delivery menu can be shorter than the dine-in menu if some items arrive poorly or tie up a station at the wrong time.
Do not respond to a fee problem by randomly inflating every delivery price and hoping no one notices. Price differences may be allowed under the platform’s terms and local rules, but guests notice confusing or unexplained jumps. Model the economics, check the contract, and make the value obvious.
The market is big. Your slice needs a label.
Statista’s U.S. online food-delivery forecast puts the 2026 market at approximately $473 billion. Important footnote before anyone puts that number in a pitch deck: Statista’s category includes grocery delivery as well as meal delivery, and the measure is gross merchandise value, not the net revenue earned by restaurants or delivery platforms.
A separate forecast cited in an October 2026 market report projects the U.S. online meal-delivery market at $67.85 billion in 2034, with a 9.05% compound annual growth rate from 2025. These numbers use different scopes and should not be compared as if they were two estimates of the same market.
The takeaway is less dramatic, and more useful: digital delivery is large, but market size doesn’t tell you whether your order makes money. Your menu mix, check average, channel terms, repeat rate and delivery geography do.
What to do Monday morning
Bring your GM, finance lead, digital lead and whoever has the platform statements. Put the burrito under a bright light.
- Pull 30 days of orders by channel. Separate marketplace delivery, direct delivery, direct pickup, phone, drive-thru and dine-in where possible.
- Build a real channel-cost sheet. For each channel, list commission, processing, software allocation, ads, promos, refunds, packaging, delivery subsidy and incremental labor.
- Calculate contribution by item and channel. Start with sales, subtract food and packaging, then channel-specific costs. Keep fixed overhead separate so the comparison stays clear.
- Check marketplace statements against contracts. Verify plan, fee base, promotional funding, processing and any service charges. Published delivery app commission rates are a reference point, not a substitute for your contract.
- Audit your first-party funnel on a phone. Test the menu, checkout, payment, confirmation, pickup instructions, delivery promise and loyalty capture. Fix the annoying thing that makes guests quit first.
- Choose the marketplace’s job. Decide where discovery is worth the cost and where you can reasonably encourage a future direct order.
- Review delivery performance with the kitchen. Identify items that travel badly, packaging that fails, bottlenecks and peak periods where delivery crowds out better-margin work.
- Set a 30-day test. Try one improvement: a better direct-order link, a pickup bundle, a menu edit or a targeted offer. Track direct-order conversion, repeat rate, contribution per order, refunds and guest feedback.
The apps may make money from commissions, consumer fees and advertising. Couriers are paid to move orders, though their actual take-home depends on the arrangement, expenses and tips. Restaurants can earn profitable incremental business, or spend margin to buy sales. Guests pay for convenience and decide whether the final experience was worth it.
So, who actually makes money on a delivered burrito?
The restaurant that knows its channel costs, protects the guest experience and gives each ordering path a clear job. Not the restaurant with the most tablets. Not the one with the loudest sales graph. And definitely not the one who mistakes a busy kitchen for a healthy P&L.
Boring wins. Boring pays. And a burrito that arrives intact, on time, at a price the guest understands? That’s not boring. That’s good systems.
SEO metadata
Meta description: Who makes money on a delivered burrito? Explore restaurant delivery commissions in 2026, a worked $40 order example, first-party ordering, hybrid channel strategy and a practical Monday checklist.
Suggested URL slug: restaurant-delivery-commissions-2026-delivered-burrito
Target SEO keywords: restaurant delivery commissions 2026, third-party delivery fees, first-party ordering, off-premise dining, delivery app commission rates, direct online ordering for restaurants, restaurant systems pro, restaurant system pro, why do restaurants fail, tip management software, video analytics for restaurants, group purchasing organizations food service.
Tags: Restaurant delivery, off-premise dining, restaurant technology, first-party ordering, delivery app fees, restaurant profitability, Robert Kuypers, Robert William Kuypers, William Kuypers, Rob Kuypers.
Hashtags: #RestaurantBusiness #RestaurantOwners #RestaurantTechnology #RestaurantMarketing #FoodDelivery #OffPremiseDining #RestaurantProfitability #Hospitality #RobertKuypers #KuypersCreative
